
Matt Campbell
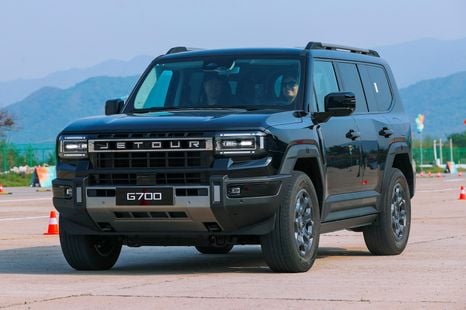
2026 Jetour G700: Quick drive
This is one of the biggest and boldest off-road SUVs on the planet... and it's coming to Australian showrooms!
5 Hours Ago
We take a look at new vehicle sales over the past 25 years to see which brands have risen and which have fallen.

Publisher
Publisher
For the data nerds out there, or those of you that just love to see how different brands have managed their sales in Australia for the last 25 years, we have put together a visualisation that will showcase two things.
Firstly, the year-by-year sales chart below will show you how some brands moved up and down the charts as the years went by. Have a look at Holden in particular as it disappears from the landscape.
These figures are not cumulative and are reflective of year-by-year sales, including passenger vehicles, SUVs, and both light and heavy commercial vehicles.
Press play below the graph:
Now, here is a cumulative graph of all total sales for the last 25 years. This data is missing certain brands (e.g. Tesla) that didn’t report their sales for a number of years as the recent data would be inaccurate as a total.
This graph also includes passenger vehicle, SUV, and light and heavy commercial vehicle sales.
Press play below the graph:
Did the graphs surprise you?
Alborz Fallah is a CarExpert co-founder and industry leader shaping digital automotive media with a unique mix of tech and car expertise.
Matt Campbell
5 Hours Ago

William Stopford
20 Hours Ago

Damion Smy
21 Hours Ago

Dave Kavermann
21 Hours Ago

Derek Fung
22 Hours Ago


Ben Zachariah
1 Day Ago
Add CarExpert as a Preferred Source on Google so your search results prioritise writing by actual experts, not AI.