
Matt Campbell
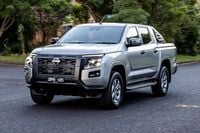
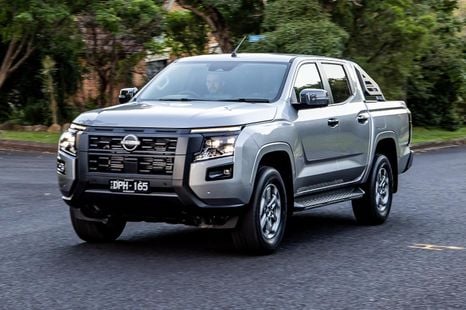
2026 Nissan Navara ST review
Nissan has reworked its work-ready Navara ute range, and this variant stands out as a tidy new truck for the worksite.
5 Hours Ago
Australia's most popular new models have changed a lot over the past few decades, including three vehicles since 2015 and five since 1998.

Publisher
Publisher
The Holden Commodore was the best-selling car in Australia from 1998 to 2010. Having passed that honour on to Mazda and then eventually Toyota and now Ford, the once-iconic Australian auto brand never recovered.
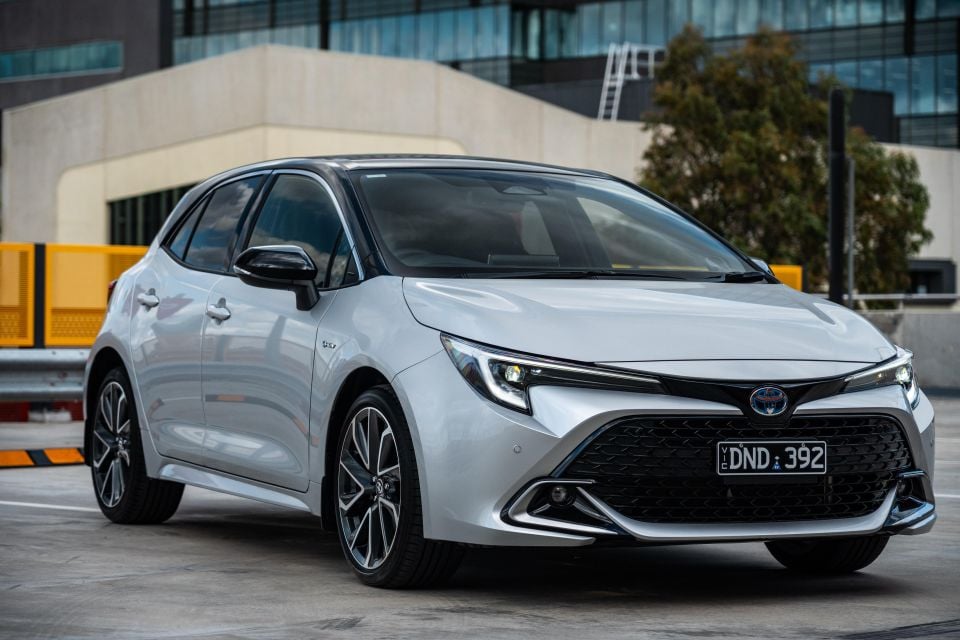
Going back to 2015, Australia’s best-selling car was the Toyota Corolla with 42,073 deliveries, representing 3.64 per cent of the total market of 1,155,408 vehicles. From there, the baton was passed to the Toyota HiLux, which became the annual leader for seven consecutive years (2016-2022). Then the Ford Ranger took over as the nation’s best-seller in 2023, and continued to hold the top spot in 2024 and 2025.
That ‘winner list’ is short, but the underlying sales volumes are not. The HiLux’s peak year in this dataset was 2022, when it found 64,391 new homes and accounted for 5.95 per cent of the entire market. The Ranger era is also strong, even as overall competition and model proliferation increase. The Ranger finished 2025 with 56,555 deliveries, or 4.56 per cent of the total market of 1,241,037, at a time when there have never been more utes on sale in Australia.
CarExpert can save you thousands on a new car. Click here to get a great deal.
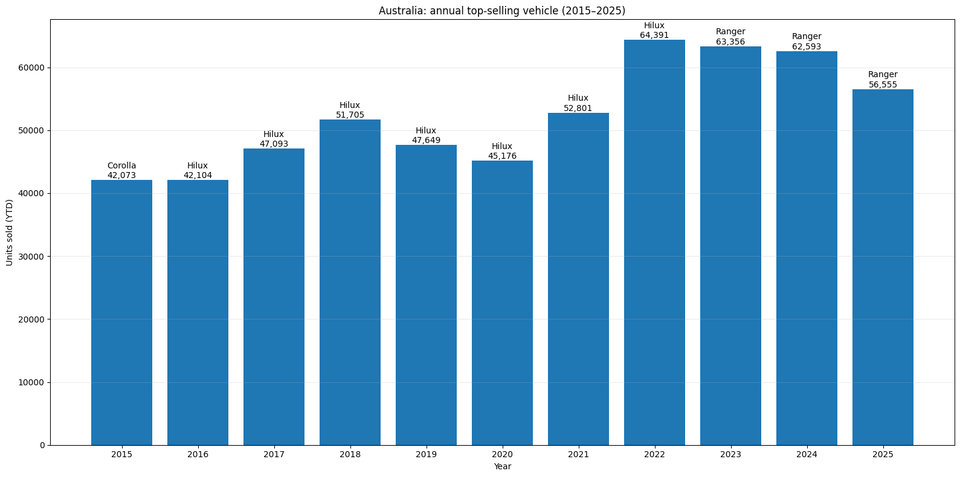
Between 2015 and 2025 the annual best-seller increased from 42,073 to 56,555 deliveries, a lift of 14,482 vehicles. That’s an important little side note, because despite more competition, more brands and more models, the total market grew by a much smaller margin over the same period, from 1,155,408 to 1,241,037. The top-selling model’s market share is therefore a useful signal. It increased from 3.64 per cent in 2015 to a high of 5.95 per cent in 2022, before settling back to 4.56 per cent in 2025.
That pattern aligns neatly with the broader shift, as passenger cars shrank dramatically in popularity over the decade, while SUVs and light commercials expanded. The best-seller story is simply that shift expressed as a single line item: first a mainstream passenger nameplate (Corolla), then a ute (HiLux), then another ute (Ranger) that better matches where demand and product momentum sit in the 2020s.
The change isn’t just in who wins, but in what the top 10 looks like at the beginning versus the end of the dataset.
In 2015, the top 10 list was heavy with household passenger-car nameplates: Corolla led, followed by Mazda3, with the Hyundai i30, Commodore, and Toyota Camry also inside the 10. Utes were present (HiLux, Ranger, Mitsubishi Triton), and an SUV (the Mazda CX-5) also appeared, but the ‘centre of gravity’ still leaned towards passenger cars.
By 2025, the top 10 sellers list reads like a modern Australian driveway and worksite mix. The top three are Ranger (56,555), Toyota RAV4 (51,947) and HiLux (51,297). After that comes a stack of high-volume SUVs and utes: Isuzu D-Max, Ford Everest, Toyota Prado, Hyundai Kona, Mazda CX-5, and Mitsubishi Outlander. The 10th-placed model in 2025 is also a marker of the new era: the Tesla Model Y on 22,239 deliveries, accounting for 1.79% of the total market.
Another ‘health check’ on the market’s shape is the entry ticket to the top 10. In 2015, in 10th place was the Volkswagen Golf with 22,092 sales. In 2025, 10th place was the Model Y electric SUV with 22,239. Despite huge changes in segment mix and brand competition, the top-10 cutoff has landed in a similar place at the start and end of the period (it dipped in 2020 during the market downturn, when the Hyundai Tucson was 10th with 15,789).
If you zoom out across the full 2015-2025 run, the ‘big picture’ isn’t just which models topped each year. It’s also which vehicles became the market’s constant high-performers.
Across all 11 years in the sales data represented here, the top cumulative sellers are the HiLux (551,987) and Ranger (513,186), followed by the RAV4 (354,888) and Corolla (328,459). That cumulative leaderboard reinforces the narrative: utes and SUVs are now the foundation of Australia’s high-volume reality, while the passenger-car leaders that remain are the exceptions, not the rule.
| Rank | Nameplate | Cumulative sales (2015–2025) |
|---|---|---|
| 1 | Toyota Hilux | 551,987 |
| 2 | Ford Ranger | 513,186 |
| 3 | Toyota RAV4 | 354,888 |
| 4 | Toyota Corolla | 328,459 |
| 5 | Mazda CX-5 | 269,912 |
| 6 | Hyundai i30 | 266,895 |
| 7 | Mitsubishi Triton | 239,977 |
| 8 | Isuzu Ute D-Max | 236,908 |
| 9 | Mazda3 | 231,771 |
| 10 | Toyota Prado | 199,908 |
| Year | Make Model | Sales |
|---|---|---|
| 1998 | Holden Commodore | 94,635 |
| 1999 | Holden Commodore | 85,648 |
| 2000 | Holden Commodore | 83,610 |
| 2001 | Holden Commodore | 85,422 |
| 2002 | Holden Commodore | 88,478 |
| 2003 | Holden Commodore | 86,553 |
| 2004 | Holden Commodore | 79,170 |
| 2005 | Holden Commodore | 66,794 |
| 2006 | Holden Commodore | 56,531 |
| 2007 | Holden Commodore | 57,307 |
| 2008 | Holden Commodore | 51,093 |
| 2009 | Holden Commodore | 44,387 |
| 2010 | Holden Commodore | 45,956 |
| 2011 | Mazda3 | 41,429 |
| 2012 | Mazda3 | 44,128 |
| 2013 | Toyota Corolla | 43,498 |
| 2014 | Toyota Corolla | 43,735 |
| 2015 | Toyota Corolla | 42,073 |
| 2016 | Toyota Hilux | 42,104 |
| 2017 | Toyota Hilux | 47,093 |
| 2018 | Toyota Hilux | 51,705 |
| 2019 | Toyota Hilux | 47,649 |
| 2020 | Toyota Hilux | 45,176 |
| 2021 | Toyota Hilux | 52,801 |
| 2022 | Toyota Hilux | 64,391 |
| 2023 | Ford Ranger | 63,356 |
| 2024 | Ford Ranger | 62,593 |
| 2025 | Ford Ranger | 56,555 |
Alborz Fallah is a CarExpert co-founder and industry leader shaping digital automotive media with a unique mix of tech and car expertise.
Matt Campbell
5 Hours Ago
Alborz Fallah
11 Hours Ago


James Wong
13 Hours Ago
Alborz Fallah
17 Hours Ago

Damion Smy
19 Hours Ago
Alborz Fallah
19 Hours Ago
Add CarExpert as a Preferred Source on Google so your search results prioritise writing by actual experts, not AI.